Simulating Functional Data with fda.clust
Manuel Oviedo (UDC), Manuel Febrero (USC)
2024-12-16
Source:vignettes/Simulations.Rmd
Simulations.RmdIntroduction
The fda.clust package provides powerful tools for
clustering functional data. To test and benchmark the performance of
these clustering methods, it is essential to generate synthetic
functional data with known properties. This vignette introduces the main
functions for simulating functional data using fda.clust,
namely rprocKclust() and rprocKmu().
These functions allow users to generate functional data with a predefined number of clusters, controlled smoothness, and variability.
Simulating Functional Data
The fda.clust package offers the following key functions
for data generation:
-
rprocKclust(): Simulates functional data with a known number of clusters. -
rprocKmu(): Simulates mean functions for multiple clusters.
Each function provides a set of parameters that allow control over the type, smoothness, and structure of the generated data.
Generating Data with rprocKclust()
The rprocKclust() function generates functional data for
K clusters. Users can control the number of observations
per cluster, the type of generating process, and the variability of the
curves.
Usage
rprocKclust(t, n, process, c, s)Arguments:
-
t: A numeric vector defining the time points where the functional data is observed. -
n: A vector specifying the number of curves in each cluster. -
process: A vector defining the process type for each cluster (e.g., “sin”, “cos”, etc.). -
c: A numeric vector indicating shifts or translations for each cluster. -
s: A numeric vector controlling the smoothness or variability of each cluster.
Example
library(fda.clust)

set.seed(123)
t <- seq(0, 2 * pi, length.out = 101)
res <- rprocKclust(t, n = c(30, 50, 40),
                   process = c("cos_sin", "sin", "cos"),
                   c = c(-1, 1, 1),
                   s = c(0.2, 0.3, 0.1))
sim_data <- res$X
group <- res$groups

plot(sim_data, col = rainbow(3)[group], main = "Simulated Data from rprocKclust")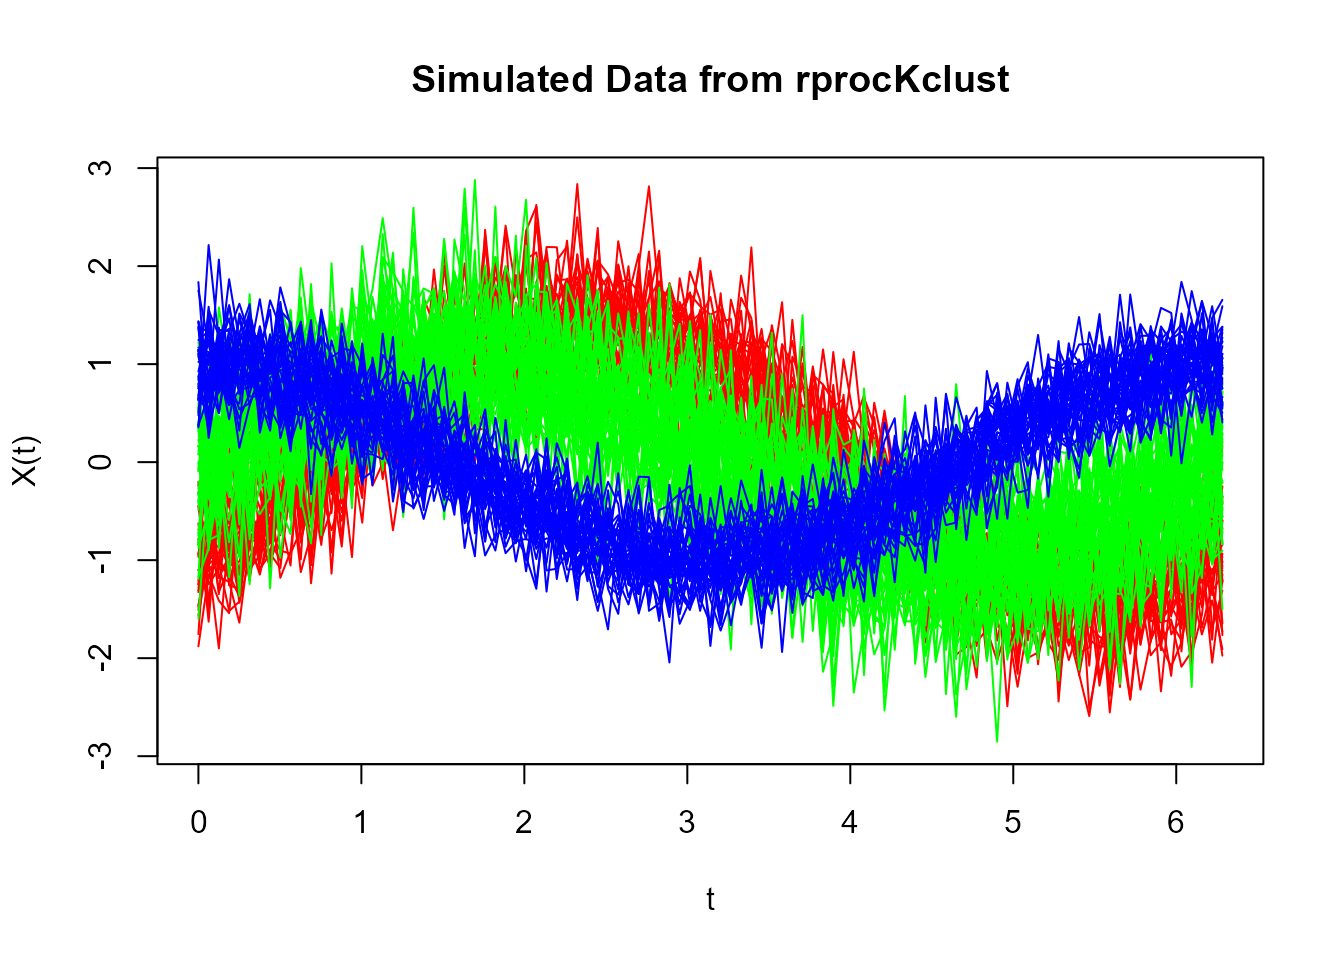
Functional data
The plot above illustrates the curves generated by
rprocKclust(), with three distinct clusters, each having
different shapes, shifts, and variability.
Generating Mean Functions with rprocKmu()
The rprocKmu() function generates mean functions for
K clusters. This is useful for controlling the general
shape or structure of the curves within each cluster.
Usage
rprocKmu(t, process, c)Arguments: - t: A numeric vector
defining the time points where the mean functions are evaluated. -
process: A vector defining the process type for each
cluster (e.g., “sin”, “cos”, etc.). - c: A numeric vector
indicating shifts or translations for each cluster.
Example
set.seed(123)
t <- seq(0, 2 * pi, length.out = 101)
mean_functions <- rprocKmu(t, process = c("cos_sin", "sin", "cos"), c = c(-1, 1, 1))

plot(mean_functions, main = "Mean Functions from rprocKmu")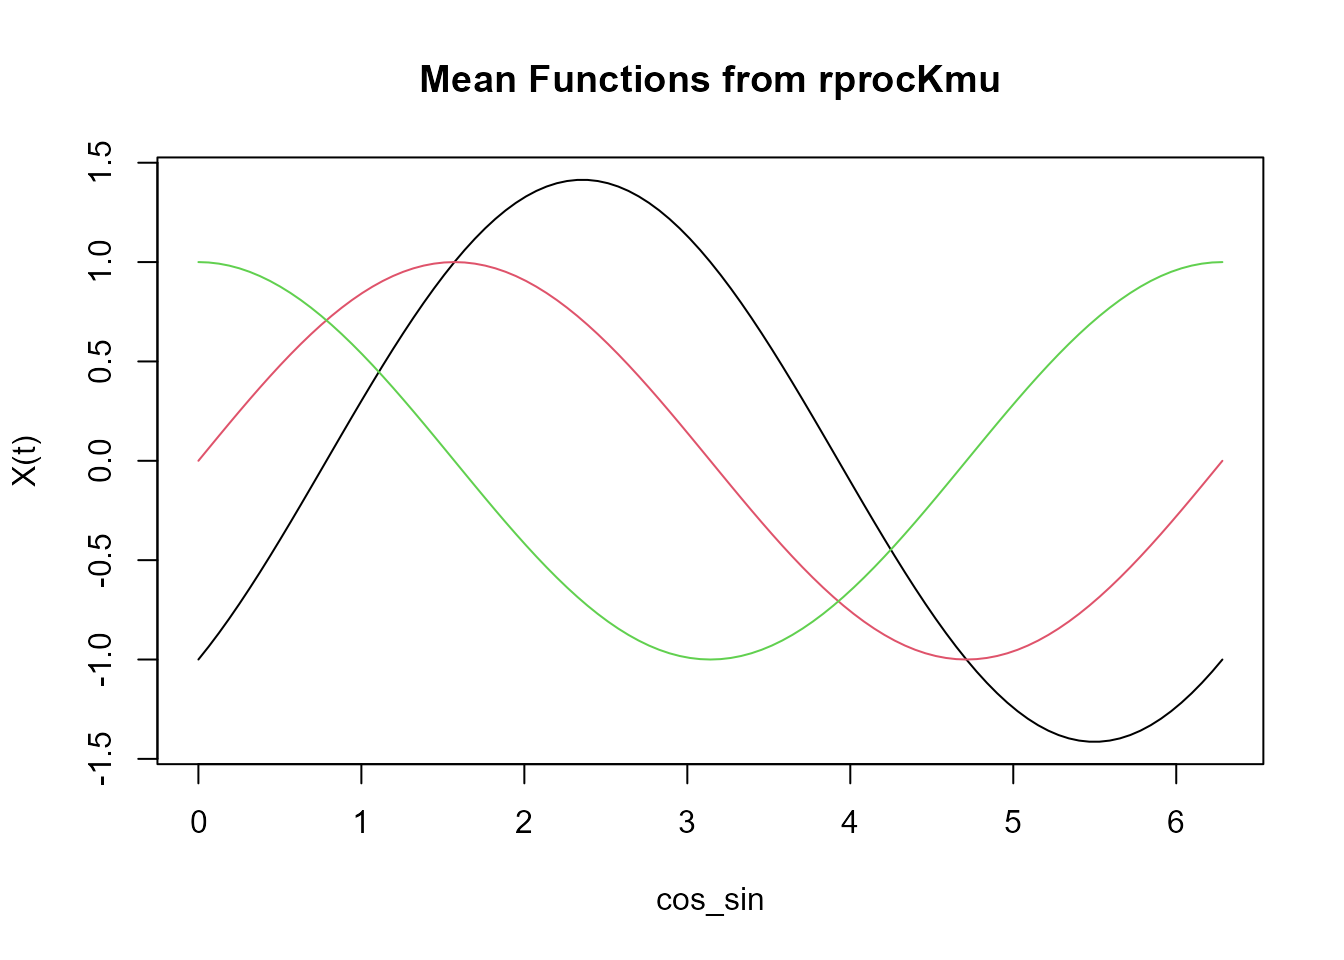
Functional centroids
The plot above shows the mean functions for three clusters. These
mean functions are later used in the rprocKclust() function
to generate actual functional data.
Customizing Simulations
The rprocKclust() and rprocKmu() functions
allow users to customize the following aspects:
-
Number of Clusters: The number of clusters can be
controlled via the
nargument inrprocKclust(). -
Types of Functions: The shape of the curves (e.g.,
sinusoidal, cosine, etc.) is defined by the
processargument. -
Smoothness: The parameter
scontrols the smoothness or variability of the generated curves.