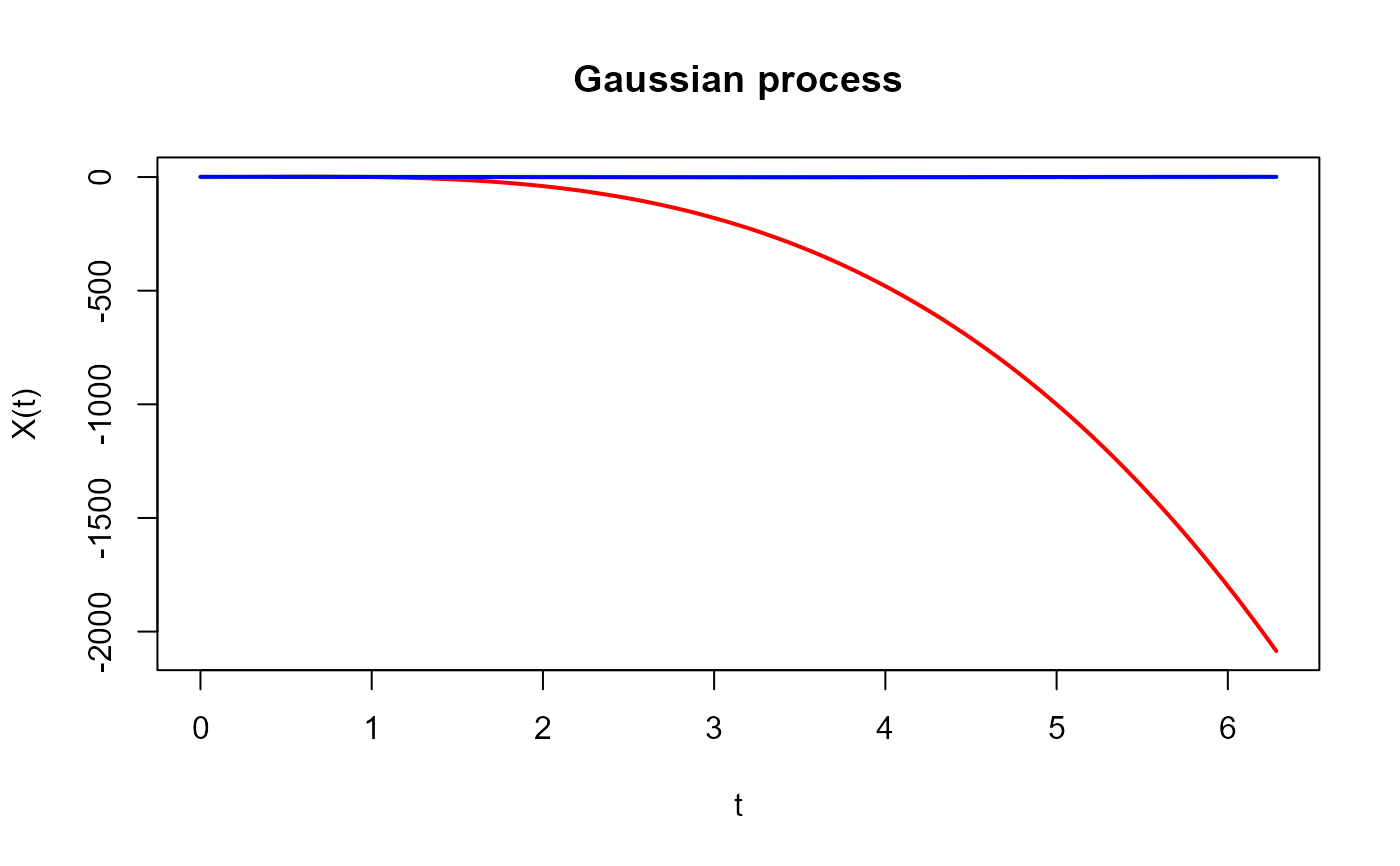
Simulates functional data for K clusters based on specified parameters for clustering analysis within the `fda.clust` package. It uses `rprocKmu` to generate the latent processes and `rproc2fdata` from `fda.usc` to generate the functional data.
Arguments
- t
A numeric vector representing the evaluation points (
argvals) at which the functional data are computed.- n
A vector of integers specifying the number of curves to be generated for each of the K clusters.
- process
A character vector of length K specifying the type of each latent process. Options include
"poly1","poly2","sin","cos","sin_cos", and"cos_sin".- c
A numeric vector of length K specifying the coefficients for each process.
- k
An optional numeric vector of length K specifying the exponents for the processes. This parameter is only relevant for
"poly1"and"poly2".- s
A numeric vector specifying the standard deviation of the noise to be added to each cluster's data. If only one value is provided, it is recycled for all clusters.
- par.list
A list of lists of additional parameters to be passed to
rproc2fdatafor generating the functional data for each cluster.- ...
Additional arguments to be passed to
rproc2fdata, allowing for further customization of the process generation.
